How to use analytics dashboard
Last updated: August 13, 2025
Videosync provides detailed analytics for all your events.
The Analytics dashboard lets you review event performance after your live stream. You can also monitor analytics during a live event, but note there’s a slight delay. For real-time information during live events, we recommend using the Livetool.
Analytics data takes some time to process after your stream ends.
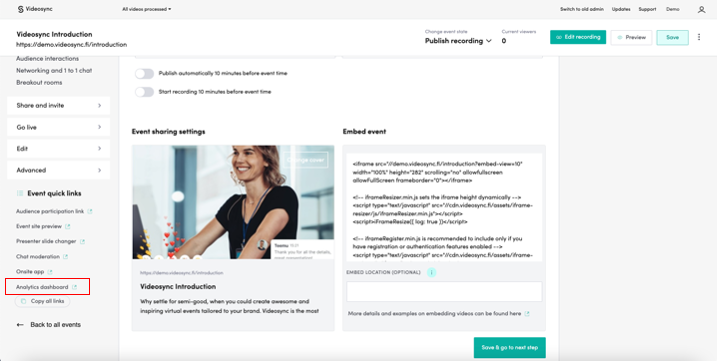
Access the Analytics dashboard from Event quick links in the admin view.
Basic components of the analytics dashboard
When you open the Analytics dashboard, you’ll see the main overview.

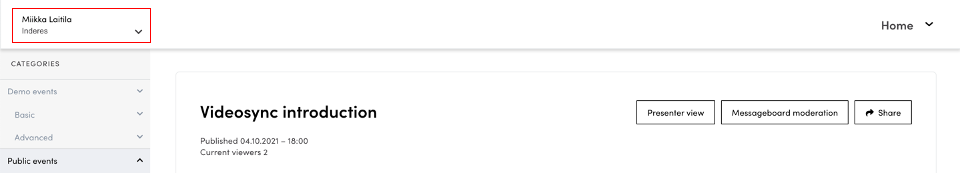
On the left side, you can see all events in your account, grouped by category.
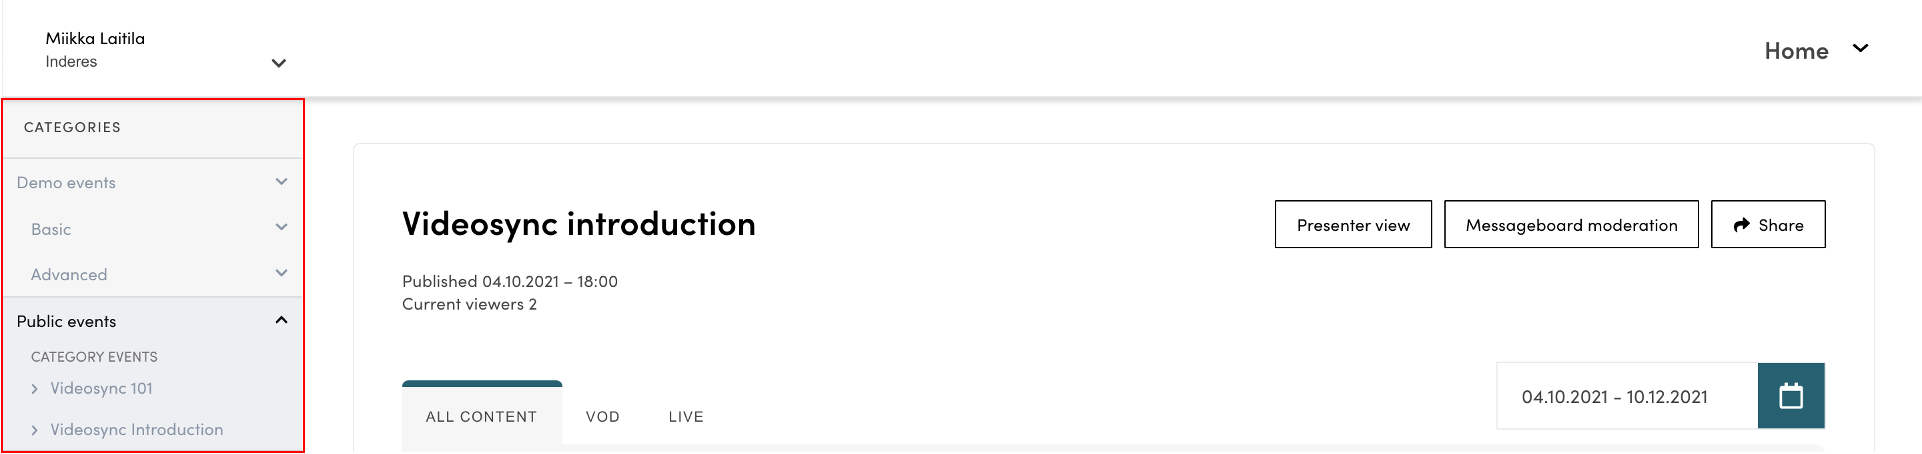
If you have access to multiple Videosync accounts, you can switch between them from the top left corner.
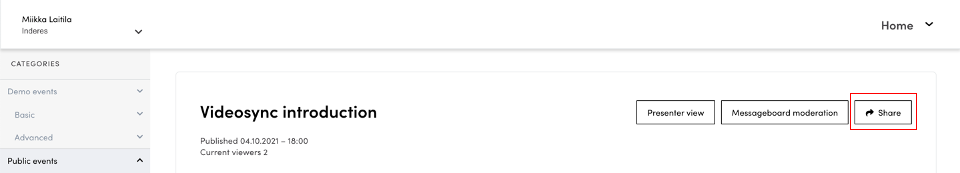
Sharing the dashboard results
To share the analytics dashboard with others (e.g., customers), use the share option in the top right corner.
When you share an event, a shareable link and password are copied to your clipboard. You can paste them directly into an email or message:
Videosync introduction dashboard: https://videosync.fi/dashboard/event/XXXXXX Password: XXXXXXX
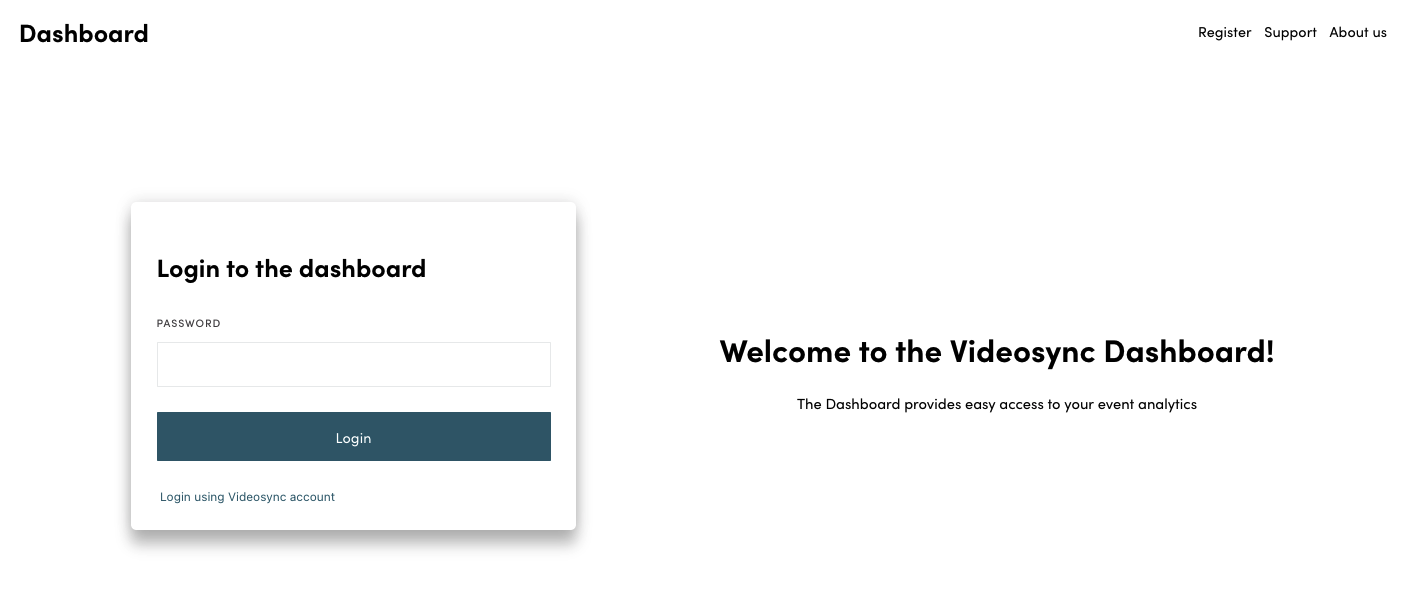
Recipients will see a login screen when opening the link.
Reading the analytics dashboard
The dashboard is divided into categories similar to the Admin panel: Video and views, Registrations, Polls, Chat, Contact requests, and Emoji reactions.
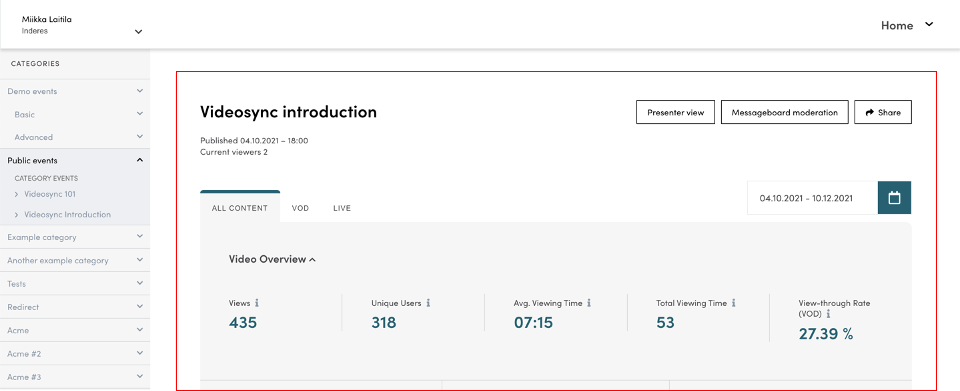
Video overview
The Video Overview section provides detailed insights into event attendance. Use the timeline filter in the top right corner to analyze specific dates or time intervals. You can also filter statistics by:
- All content (default)
- VOD: Video-on-demand viewers who watched the recording
- Live: Users who attended the live event
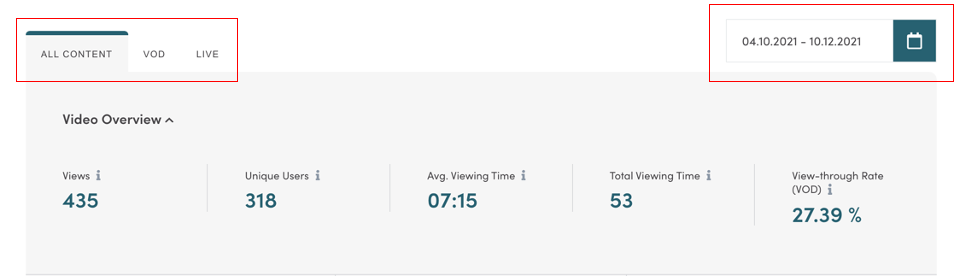
Video overview indicators:
- Views: Total views lasting over 3 seconds
- Unique Users: Number of distinct users. If one user opens the event five times on the same device, it counts as one unique user but five views
- Avg. Viewing Time: Average watch time per attendee (excludes pauses, buffering, and skipping)
- Total Viewing Time: Combined watch time of all viewers (Unique Users × Avg. Viewing Time)
- View-through Rate (VOD): Percentage of video watched on average. 100% means all viewers watched the entire event
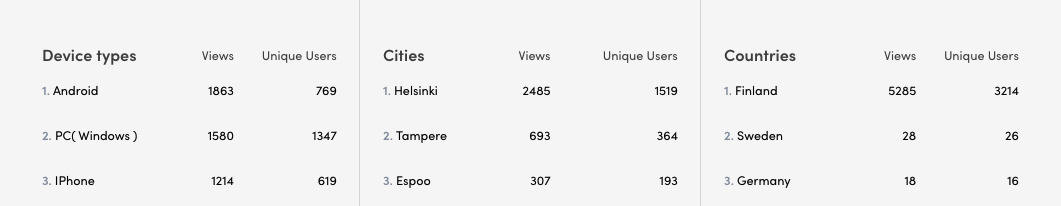
Attendee statistics:
- Device types: Shows which devices attendees used
- Cities: Location of attendees based on IP address
- Countries: Country of attendees based on IP address
Video Playback sites
Shows views by playback location. Useful if you’ve embedded your event on multiple sites.
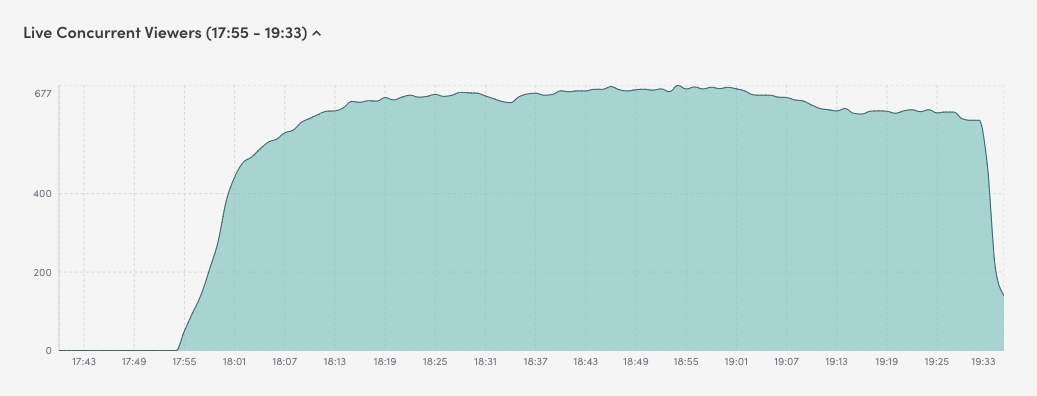
Live Concurrent viewers
Displays the number of simultaneous viewers during your live event. Hover over the graph to see exact values.
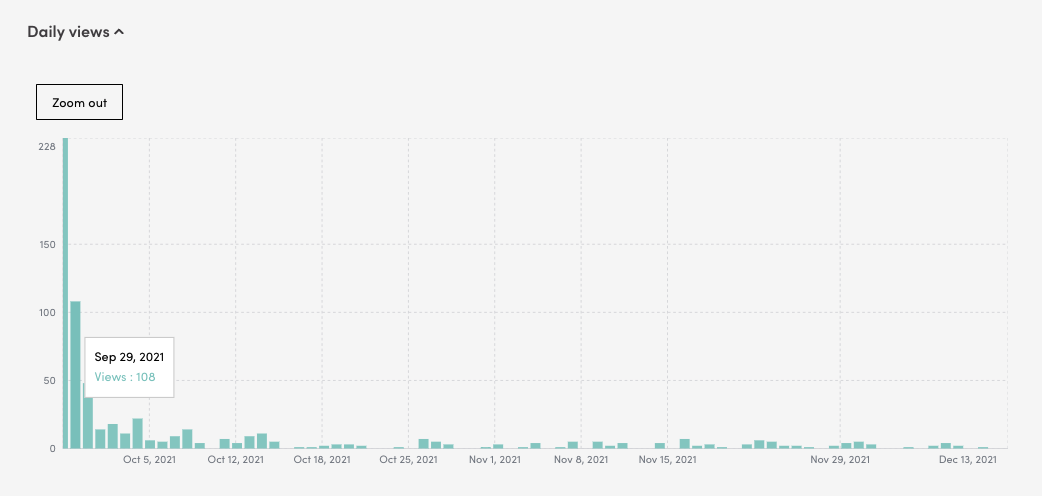
Daily views
Shows the distribution of views from the event date to today. Hover over columns to see exact values.
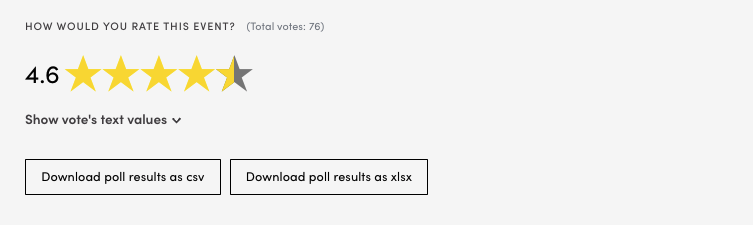
Polls
View a summary of poll responses. Download results as CSV or XLSX files for further analysis.
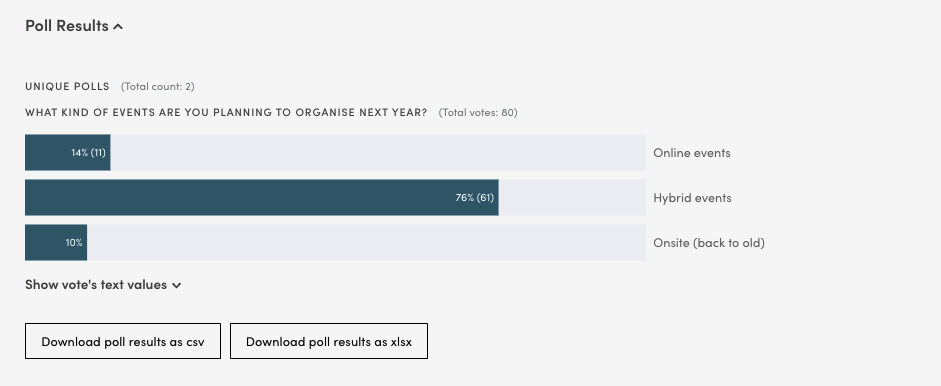
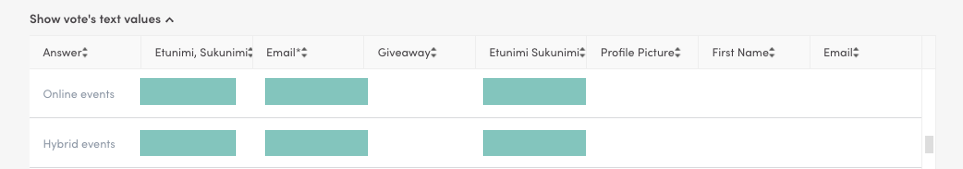
To see how individual participants voted, click Show vote’s text values.
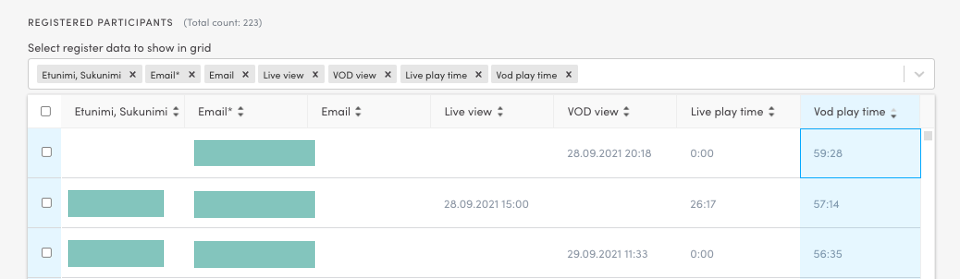
Registrations
View all registrants and their watch time for both live and recorded content. Customize the table columns by clicking the header area.
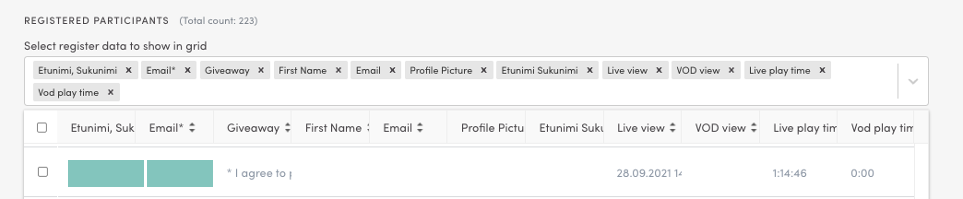
To see only live attendees, sort by Live view or Live play time.
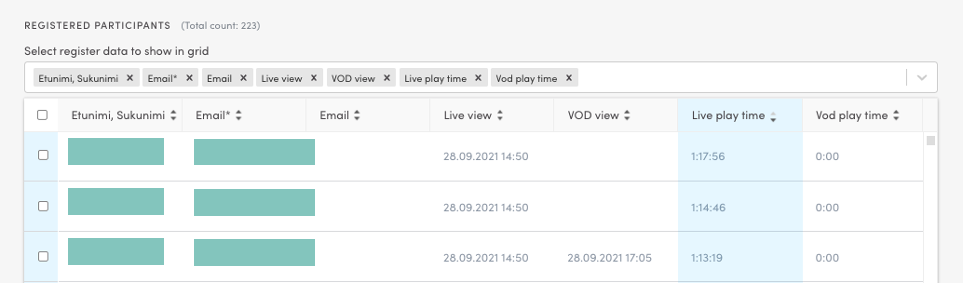
Similarly, you can identify VOD viewers and see how long they watched the recording.
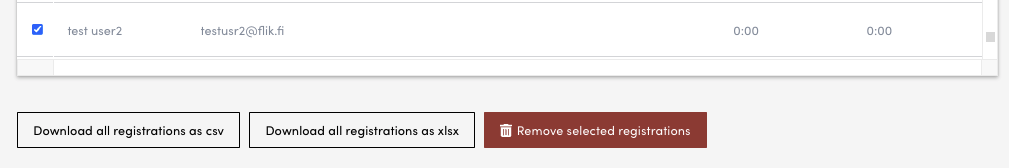
To remove registrations (e.g., test entries), select them using the checkbox and click Remove selected registration.
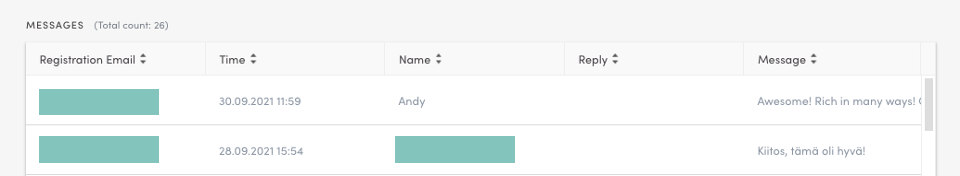
Messageboard and chat
View all messages sent in the chat, along with registration details of the senders.
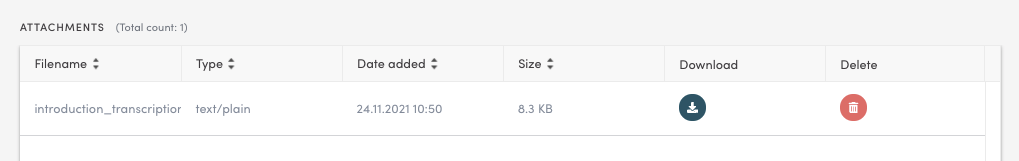
Attachments
Manage event attachments directly from the dashboard - add or remove files as needed.
Emoji reactions
View emoji reactions sent during your live event in a graph visualization. This shows which content and presenters received the most reactions and which emojis were most popular.
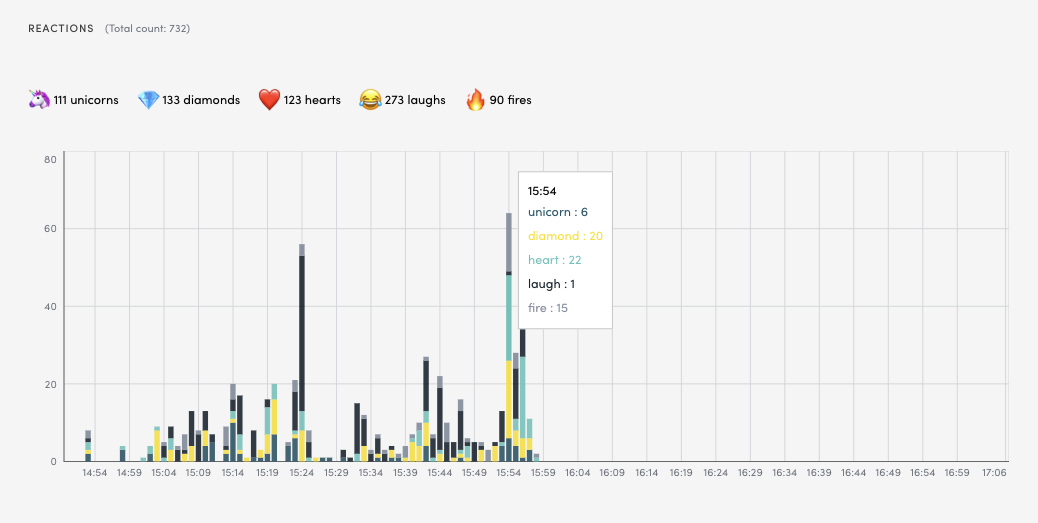
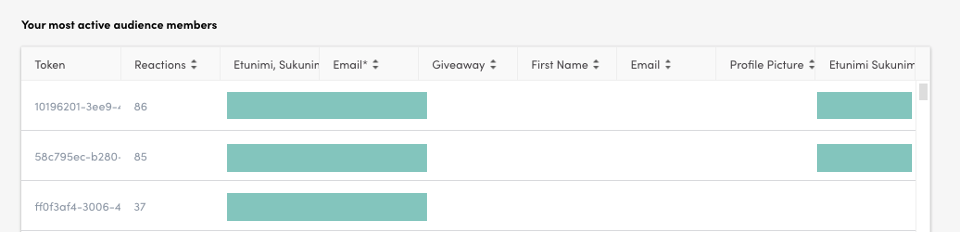
You can also see the most active users during your event.
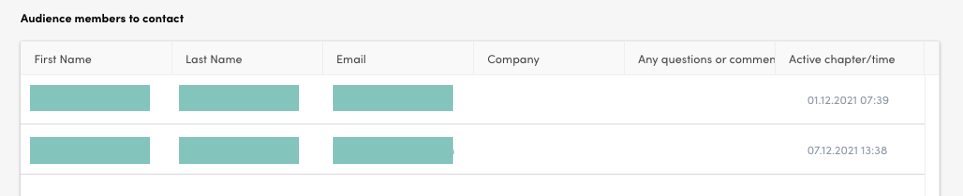
Contact requests
View contact requests submitted by users who asked to be contacted later.